


As we navigate through the complex of software engineering and system operations, observability emerges as a headlamp. This approach not only illuminates paths through intricate systems but also empowers teams with the ability to understand and resolve issues effectively. Unlike conventional monitoring, observability provides a deeper insight into the internal workings of a system, resulting in more agile and efficient issue resolution.
In this blog, our journey will lead us through the exploration of the core concept of observability. We will discuss the three fundamental pillars that support this approach. Additionally, we will dive into a comparative analysis between observability and traditional monitoring, highlighting their distinctions and importance in the current landscape.
What is Monitoring?
Monitoring is the process of continuously collecting data, grounded in standardized metrics. This practice primarily focuses on the overall health of the system, detecting anomalies and other performance indicators. While monitoring provides valuable data, it does not necessarily imply direct action but rather informs about the current state of the system. For example, it can indicate the availability of a system or the amount of traffic to a specific web page.
The concept of monitoring emerged to enable continuous and frequent tracking of systems by managers and administrators so they could take measures and act upon the metrics provided by the monitor.
What is Observability?
Observability is the ability to understand the internal behavior of a complex system through relevant signals and data, such as metrics, logs, and tracing. This approach is essential in modern systems, including micro services architectures, cloud computing, and distributed applications. With increasingly interconnected systems, the ability to identify and resolve issues effectively is crucial.
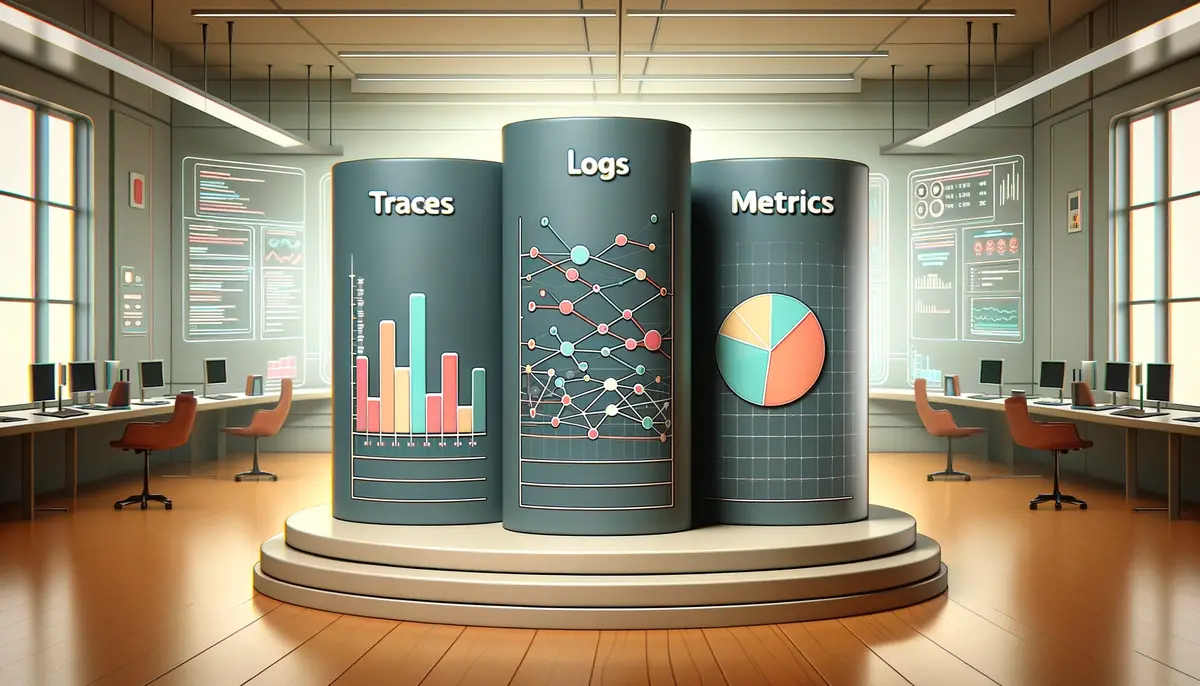
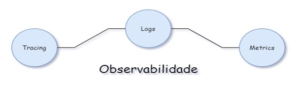
The Three Pillars of Observability
Three fundamental pillars that work together to provide a comprehensive view of the system sustain observability:
- Logs:
Logs are chronological records of activities and events that occur in a system. They offer valuable insights into the execution flow and allow developers to trace the sequence of actions that led to a particular state. Log analysis can be a powerful tool for understanding the root causes of issues and reconstructing past events.
- Metrics:
Metrics are numerical values that represent specific characteristics of the system at a given time. They can range from CPU performance and memory usage to API response time. Monitoring metrics over time helps identify patterns, anomalies, and trends, enabling proactive optimization and detection of emerging issues.
- Tracing:
Traces involve tracking requests as they go through many components of a system. This allows visualizing the complete flow of a transaction and identifying bottlenecks or delays in individual services. Traces are particularly valuable in distributed architectures, where multiple parts of a system may be interacting.
Monitoring vs. Observability
While monitoring focuses on displaying high-level metrics, observability provides a deeper understanding, revealing the root causes of issues. Observability enables a more detailed analysis of the internal behavior of system components and is particularly effective in debugging complex and distributed systems.
Observability stands out by:
– Allowing a deeper analysis of the root causes of issues.
– Enabling understanding of the internal behavior of system components.
– Facilitating effective debugging of complex and distributed systems.
– Providing a more holistic view of interactions between system elements.
Observability Tools
Several tools today provide various solutions for handling the volume, management, and analysis of captured data for observability. Some examples include:
Grafana:
- Ease of Use: Intuitive interface with drag-and-drop, variables, and folder organization. Offers community-built pre-built dashboards.
- Customization and Flexibility: Highly customizable dashboards with a variety of visualizations and an extensive plugin library.
- Alerting and Reporting Capabilities: Setting limits for fields, organizing alerts, sending to multiple applications, and customizable reports.
- Integrations and Compatibility: No proprietary database, integrates with various data sources and platforms.
- Cost and Licensing: Open-source with three types of plans: Free, Cloud Pro, and Cloud Advanced.
Splunk:
- Ease of Use: Steep learning curve with its own query language (SPL), advanced features in the paid version.
- Customization and Flexibility: Custom reports via SPL, development of a new visualization tool (Splunk Dashboard Studio).
- Alerting and Reporting Capabilities: Scheduled or real-time alerts, email and webhook notifications.
- Integration and Compatibility: Proprietary database, receiving data from various sources.
- Cost and Licensing: Cloud or Enterprise version, payment based on data usage and monitoring activities.
Elastic Stack:
- Ease of Use: Separate processes with distinct learning curves for ElasticSearch and Kibana.
- Customization and Flexibility: ElasticSearch API for custom queries and ingestion, wide variety of customizations in Kibana.
- Alerting and Reporting Capabilities: Use of Watcher for creating specific alert conditions.
- Integration and Compatibility: Tools like Logstash and Beats for automatic data collection and sending.
- Cost and Licensing: Open-source with advanced features in the paid version.
Dynatrace:
- Ease of Use: Automated agent for mapping and monitoring the environment, with automatic dashboard generation.
- Customization and Flexibility: Customization possibilities in data collection and dashboard development.
- Alerting and Reporting Capabilities: AI for smart alerts, focusing on problems and their root causes.
- Integration and Compatibility: Automatic system detection, facilitating monitoring, with OpenTelemetry support.
- Cost and Licensing: Not open-source, payment based on data usage and features.
OpenTelemetry:
OpenTelemetry is an open-source observability framework for instrumentation, generation, collection, and export of telemetry data (traces, logs, and metrics). It is also known as Otel, created by the merger of two projects OpenTracing and OpenCensus, it is the main means of semantic convention and protocol standards for all suppliers, which can integrate and extend their solutions with Otel. There are more than 40 suppliers, including open-source suppliers.
- Ease of Use: Various ways to use, by integration with code or environment, automatic or manual telemetry data capture.
- Customization and Flexibility: Extremely flexible and customizable.
- Alerting and Reporting Capabilities: It does not have it because it is not its purpose.
- Integration and Compatibility: Integrates with various types of observability tools, open-source or commercial.
- Cost and Licensing: Fully open-source.
Applied Proposal – Practical Guide
In the dynamic world of e-commerce, the efficiency and reliability of web applications are crucial. A robust monitoring and observability strategy can be the key to success. Let us explore how to implement an effective system using cutting-edge technologies like OpenTelemetry and Grafana.
Integration with OpenTelemetry for Comprehensive Data
Considering a web application in e-commerce, the first step is to ensure comprehensive data collection. Here, integration with OpenTelemetry (Otel) is vital. We can deploy the software during its development, allowing manual or automatic instrumentation. The tool supports various languages such as Java, Python, .Net, Go, PHP, JavaScript, Ruby, etc. In addition to deployment in the software, it is possible to insert directly into the server, where there is no need to modify the code directly. With this, the difference between these methods is that server insertion does not allow customization.
Instrumentation is the action of making the system observable, that is, system components must generate traces, metrics, and logs.
Otel uses a component called Collector that can centralize all telemetry data in one place. Through data collection, processing, and distribution to suppliers, it facilitates maintenance and integration between tools, without the need for modification in the code.
Advanced Analysis and Monitoring with Grafana
Grafana emerges as a powerful tool for the analysis and monitoring of this data. Although Grafana does not have its own data storage system, it seamlessly integrates with specialized storage solutions:
Prometheus for Metrics: We use Prometheus, a database designed specifically for metrics, facilitating real-time performance monitoring.
Grafana Loki for Logs: For log management, Grafana Loki is the ideal choice. Its design optimizes log querying and storage, using efficient indexing by metadata.
Grafana Tempo for Traces: Finally, for traces, Grafana Tempo offers an efficient storage solution without the need for complex indexes.
Integrated Alert Flow for Rapid Response
The alert system is a critical component, allowing quick identification of anomalous behaviors. We propose an integrated flow – Alert à Metrics à Logs à Traces. This flow ensures that upon receiving an alert, users – whether developers or other professionals – have immediate access to detailed information about the problem.

Usage Scenario: Fast and Efficient Diagnosis
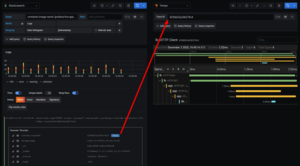
Imagine the following scenario: The user receive an alert, detailing the nature of the problem. Upon clicking the provided link, the user is directed to a dashboard in Grafana, where relevant metrics are highlighted. With the option for drilldown, it is possible to explore specific logs and traces, following the user’s path to the origin of the error.
This method allows not only to quickly identify the problem but also to understand the complete context, including business data such as user name and page section.
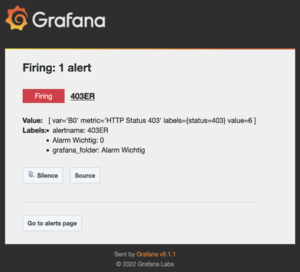
Example Alert
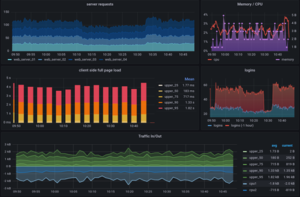
Example Metrics
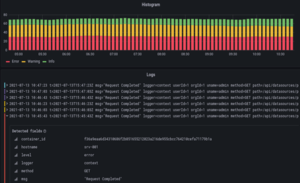
Example Logs
Example Traces
Clear Benefits: Reduced Response Time and Efficient Solution
With this approach, the response time to detected problems is significantly reduced. The ability to go directly to the source code of the error, enriched with contextual data, transforms problem resolution into a more manageable and efficient task.
Conclusion
Observability as the Key to Success in Complex Systems
Observability has become an essential element for the successful operation and maintenance of modern and complex systems. Its three pillars – logs, metrics, and traces – work together to provide a comprehensive and deep understanding of the internal behavior of systems. Unlike traditional monitoring, observability allows development and operations teams to understand systems at a deeper level, facilitating effective problem resolution and continuous optimization.